Humidity comparison: Hygrometer and isotope analyzer#
During EUREC⁴A and ATOMIC the P3 made two in situ measurements of humidity, one
with the normal chilled-mirror hygrometer, and one with a cavity ring down spectrometer.
The spectrometer’s main purpose was to measure isotopes of water vapor but it’s
good for the total humidty as well.
For this example we need to plot some xarray datasets from the catalog.
import xarray as xr
import numpy as np

import matplotlib.pyplot as plt
import pathlib
plt.style.use(pathlib.Path("./mplstyle/book"))
import colorcet as cc
%matplotlib inline

import eurec4a
cat = eurec4a.get_intake_catalog(use_ipfs="QmahMN2wgPauHYkkiTGoG2TpPBmj3p5FoYJAq9uE9iXT9N")
We’ll create a combined data with relative humidity from the aircraft hygrometer (“fl” means “flight level”) and the water vapor isotope analyzer (“iso”) from a single flight. Drop (remove) times when the aircraft is on the ground.
fl = cat.P3.flight_level["P3-0119"].to_dask()
pi = cat.P3.isotope_analyzer.water_vapor_1hz["P3-0119"].to_dask()
rhs = xr.Dataset({"press" :fl["press"],
                  "alt"   :fl["alt"],
                  "rh_p3" :fl["RH"],
                  "rh_iso":pi["rh_iso"]}).compute()
rhs = rhs.where(rhs.alt > 80., drop = True)
/home/runner/miniconda3/envs/how_to_eurec4a/lib/python3.13/site-packages/intake_xarray/base.py:21: FutureWarning: The return type of `Dataset.dims` will be changed to return a set of dimension names in future, in order to be more consistent with `DataArray.dims`. To access a mapping from dimension names to lengths, please use `Dataset.sizes`.
  'dims': dict(self._ds.dims),
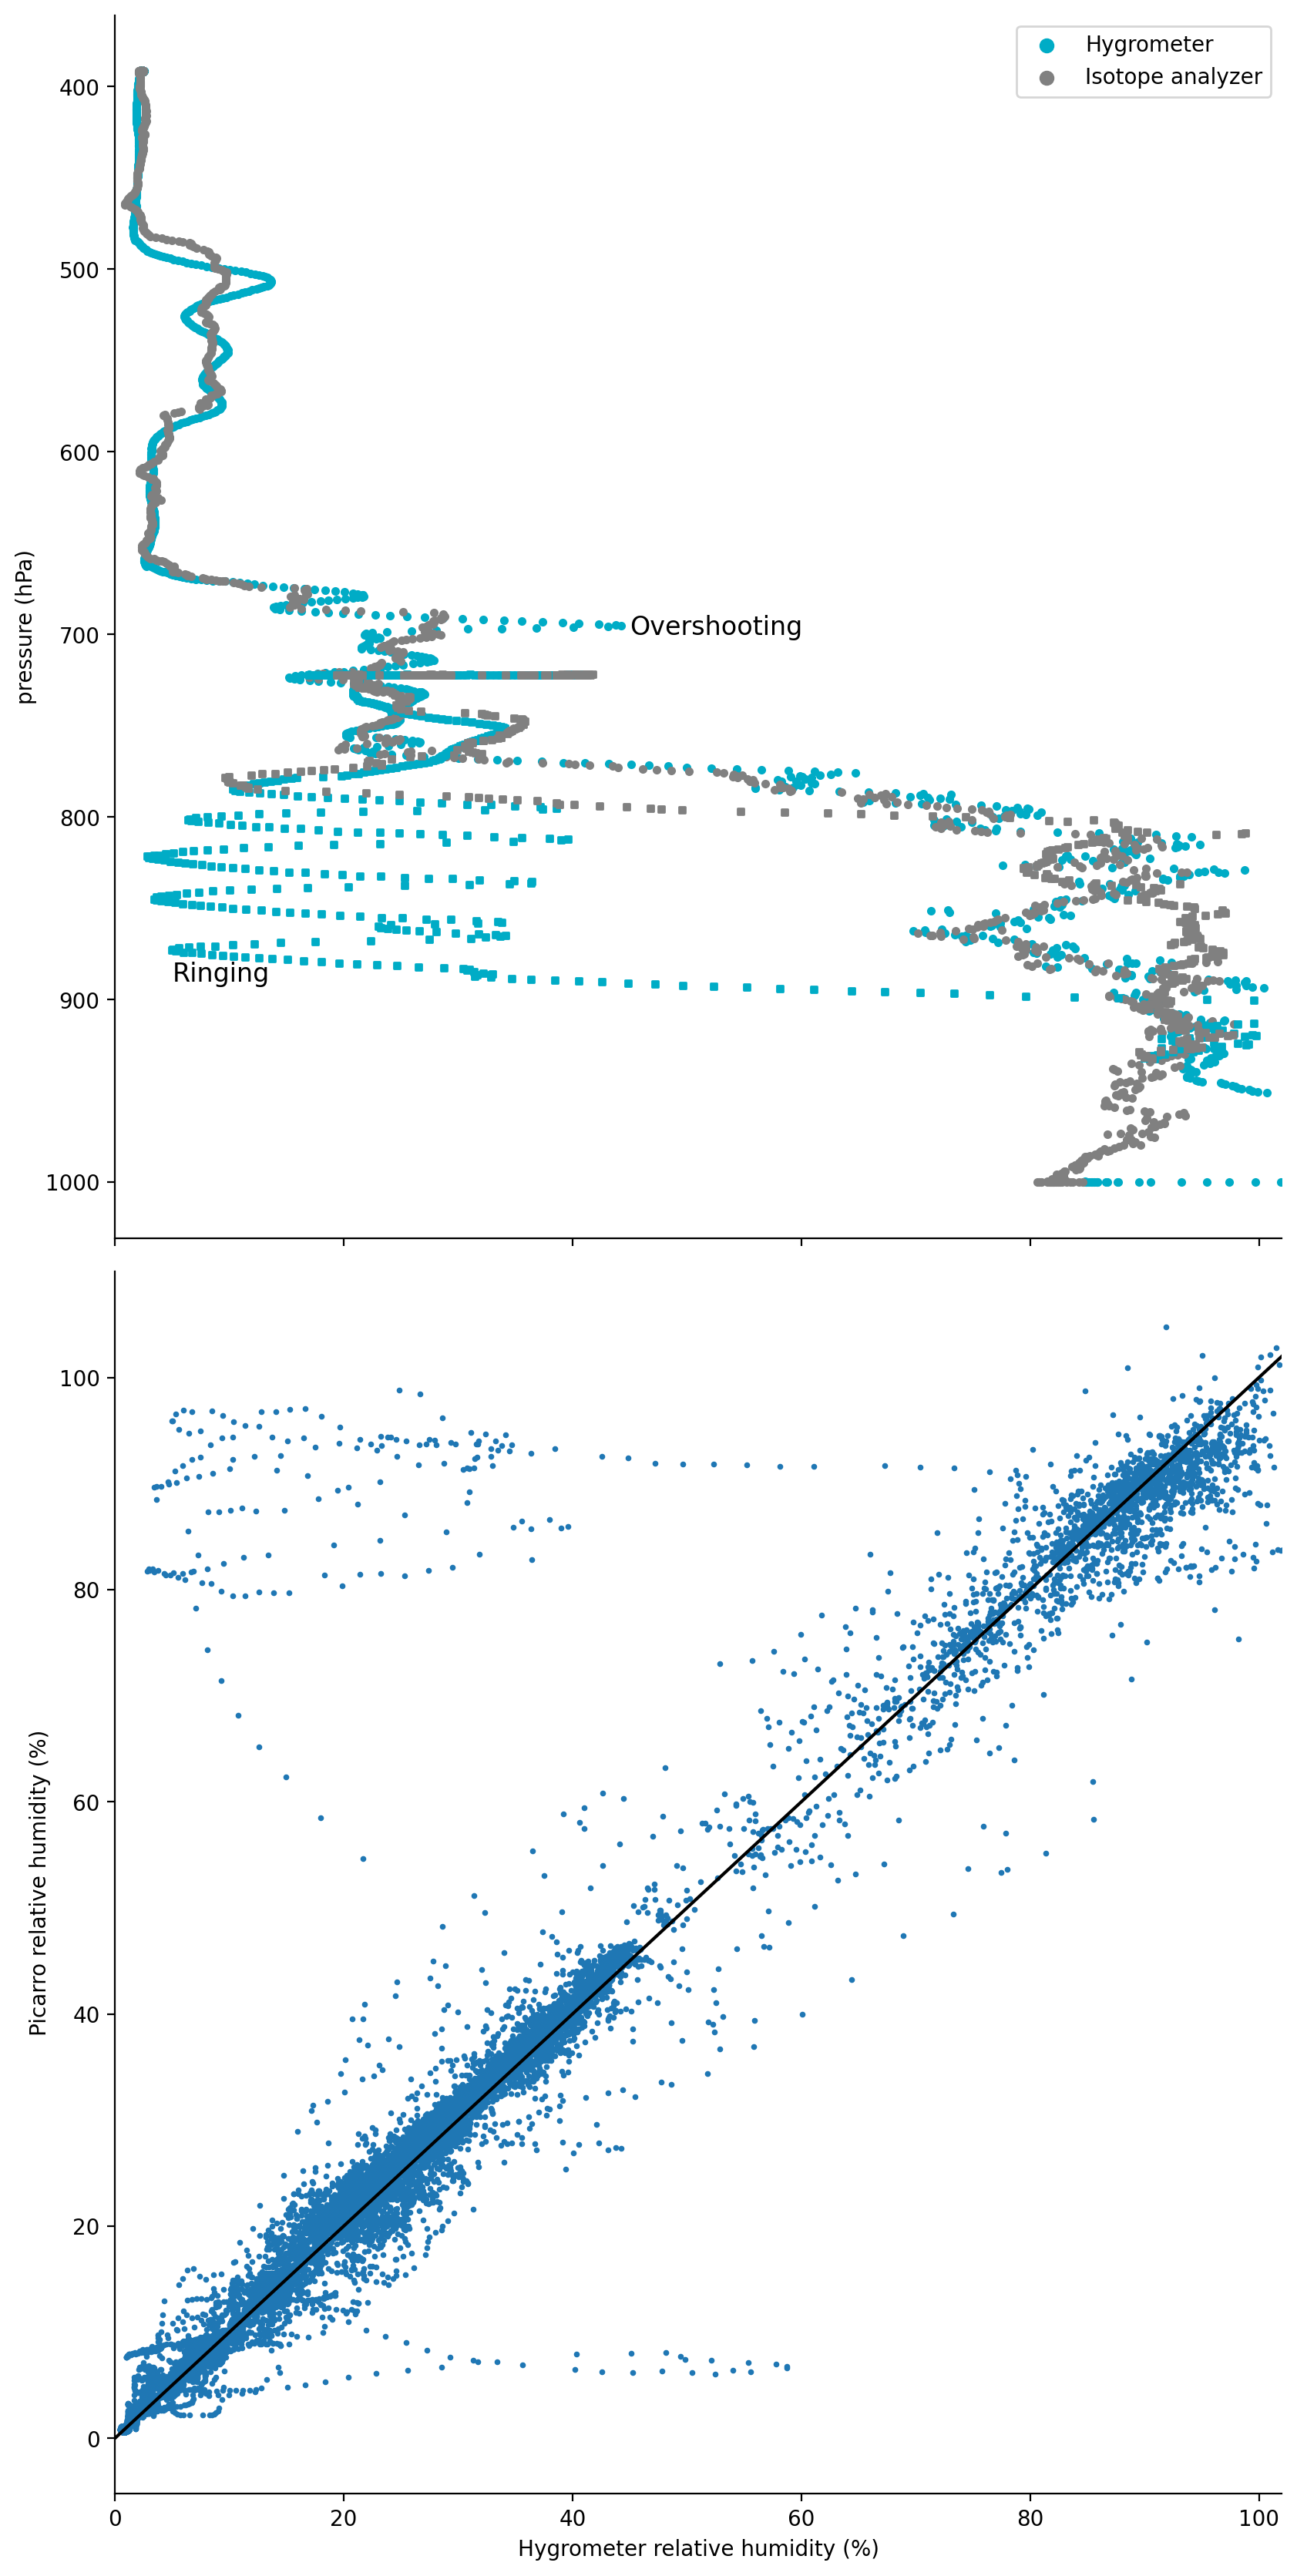
Adriana Bailey from NCAR, who was responsible for the isotope analyzer, finds that while the two instruments agree most of the time, the hygrometer is subject to both overshooting (e.g. when the measured signal surpasses the expected value following a rapid rise in environmental water vapor concentration) and ringing (i.e. rapid oscillations around the expected value) during rapid and large changes in water vapor concentration.
Here are two figures to illustrate the problem and shows why you’d want to use the water vapor measurements from the isotope analyzer when they’re available. The top panel combines data from two profiles and shows large excursions in the water vapor measured by the hygrometer. The lower panel shows that most measurements agree well but it’s clear that it’s better to use the the isotope analyzer measurements of humidity during the experiment.
fig, (ax1, ax2) = plt.subplots(nrows=2, sharex = True, figsize = (8.3, 16.6))
#
# One time window
#
profiles = rhs.sel(time = slice(np.datetime64("2020-01-19T15:36:00"),
                                np.datetime64("2020-01-19T16:07:40")))
marker = "."
ax1.scatter(profiles["rh_p3" ], profiles["press"],
           color=cc.glasbey[3], marker = marker, label = "Hygrometer")
ax1.scatter(profiles["rh_iso"], profiles["press"],
           color="0.5",         marker = marker, label = "Isotope analyzer")
#
# A second time window, shown as squares of roughly the same size
#
profiles = rhs.sel(time = slice(np.datetime64("2020-01-19T20:31:12"),
                                np.datetime64("2020-01-19T20:41:16")))
marker = "s"
ax1.scatter(profiles["rh_p3" ], profiles["press"],
           color=cc.glasbey[3], marker = marker, s = .2 * plt.rcParams['lines.markersize']**2)
ax1.scatter(profiles["rh_iso"], profiles["press"],
           color="0.5",         marker = marker, s = .2 * plt.rcParams['lines.markersize']**2)


ax1.invert_yaxis()
ax1.legend(markerscale = 2)
ax1.set_xlim(0, 100)
ax1.set_ylabel("pressure (hPa)")

ax1.annotate('Ringing',     ( 5,890), fontsize="large")
ax1.annotate('Overshooting',(45,700), fontsize="large")
#
# Picarro vs. hygrometer RH - they mostly agree
#
ax2.scatter(rhs["rh_p3"],rhs["rh_iso"], s=3)
# 1:1 line
ax2.plot([0,102], [0,102], color = 'black')
ax2.set_xlim(0, 102)
ax2.set_xlabel("Hygrometer relative humidity (%)")
ax2.set_ylabel("Picarro relative humidity (%)")
Text(0, 0.5, 'Picarro relative humidity (%)')