Ocean temperatures: AXBTs and SWIFT buoys#
During EUREC⁴A/ATOMIC the P-3 deployed 165 Airborne eXpendable BathyThermographs (AXBTs) to measure profiles of ocean temperature. (These are kind of the oceanic equivalent of dropsondes but they don’t measure salinity.) Often these were dropped around other ocean temperature measurements - for example the autonomous Surface Wave Instrument Floats with Tracking (SWIFT) buoys deployed from the Ron Brown by Elizabeth Thompson of NOAA and her colleagues. The SWIFT deployment is described in Quinn et al. (2021).
Let’s take a look at some of the AXBT measurements and how they compare to the SWIFTs.
import xarray as xr
import numpy as np
import datetime

import matplotlib.pyplot as plt
import pathlib
plt.style.use(pathlib.Path("./mplstyle/book"))
%matplotlib inline

import eurec4a
cat = eurec4a.get_intake_catalog(use_ipfs="QmahMN2wgPauHYkkiTGoG2TpPBmj3p5FoYJAq9uE9iXT9N")
Mapping takes quite some setup. Maybe we’ll encapsulate this later but for now we repeat code in each notebook.
What days did the P-3 fly on? We can find out via the flight segmentation files.
# On what days did the P-3 fly? These are UTC date
all_flight_segments = eurec4a.get_flight_segments()
flight_dates = np.unique([np.datetime64(flight["takeoff"]).astype("datetime64[D]")
                          for flight in all_flight_segments["P3"].values()])
Now set up colors to code each flight date during the experiment. One could choose a categorical palette so the colors were as different from each other as possible. Here we’ll choose from a continuous set that spans the experiment so days that are close in time are also close in color.
The P-3 only deployed AXBTs on some flights, and the SWIFT buoys were only deployed on a subset of those dates.
axbts = cat.P3.AXBT.Level_3.to_dask()
swifts = [cat[s].all.to_dask() for s in list(cat) if "SWIFT" in s]
axbt_dates = np.intersect1d(np.unique(axbts.time.astype("datetime64[D]").values),
                            flight_dates)

swift_candidates = np.unique(np.concatenate([swift.time.astype('datetime64[D]').values
                                             for swift in swifts]))
# Dates with potential SWIFT/P-3 overlap
swift_dates = np.intersect1d(swift_candidates, axbt_dates)
/home/runner/miniconda3/envs/how_to_eurec4a/lib/python3.13/site-packages/intake_xarray/base.py:21: FutureWarning: The return type of `Dataset.dims` will be changed to return a set of dimension names in future, in order to be more consistent with `DataArray.dims`. To access a mapping from dimension names to lengths, please use `Dataset.sizes`.
  'dims': dict(self._ds.dims),
/tmp/ipykernel_3943/4194817175.py:3: UserWarning: Converting non-nanosecond precision datetime values to nanosecond precision. This behavior can eventually be relaxed in xarray, as it is an artifact from pandas which is now beginning to support non-nanosecond precision values. This warning is caused by passing non-nanosecond np.datetime64 or np.timedelta64 values to the DataArray or Variable constructor; it can be silenced by converting the values to nanosecond precision ahead of time.
  axbt_dates = np.intersect1d(np.unique(axbts.time.astype("datetime64[D]").values),
/tmp/ipykernel_3943/4194817175.py:6: UserWarning: Converting non-nanosecond precision datetime values to nanosecond precision. This behavior can eventually be relaxed in xarray, as it is an artifact from pandas which is now beginning to support non-nanosecond precision values. This warning is caused by passing non-nanosecond np.datetime64 or np.timedelta64 values to the DataArray or Variable constructor; it can be silenced by converting the values to nanosecond precision ahead of time.
  swift_candidates = np.unique(np.concatenate([swift.time.astype('datetime64[D]').values
For plotting purposes it’ll be handy to define a one-day time window and to convert between date/time formats
one_day = np.timedelta64(1, "D")

def to_datetime(dt64):
    epoch = np.datetime64("1970-01-01")
    second = np.timedelta64(1, "s")
    timestamp = (dt64 - epoch) / second
    return datetime.datetime.fromtimestamp(timestamp, datetime.UTC)
Now we can make a map that shows where the AXBTs were deployed and where the SWIFTs were on days there the two platforms overlapped
fig = plt.figure(figsize = (8.3, 9.4))
ax  = set_up_map(plt)
add_gridlines(ax)

#
# AXBT locations
#
for d in axbt_dates:
    flight = axbts.sel(time=slice(d, d + one_day))
    ax.scatter(flight.lon, flight.lat,
               lw=2, alpha=0.5, color=color_of_day(d),
               transform=ccrs.PlateCarree(), zorder=7,
               label=f"{to_datetime(d):%m-%d}")

#
# SWIFT locations on selected dates (where there's overlap)
#
for d in swift_dates:
    flight = axbts.sel(time=slice(d, d + one_day))
    for swift in swifts:
        drift = swift.sel(time = flight.time.mean(), method = "nearest")
        ax.scatter(drift.lon, drift.lat,
                   alpha=1, color=color_of_day(d),
                   transform=ccrs.PlateCarree(), zorder=7, marker = "p")

plt.legend(ncol=2,loc=(0.0,0.0),fontsize=12,framealpha=0.8,markerscale=1,
           title="Flight date (MM-DD-2020)");
/home/runner/miniconda3/envs/how_to_eurec4a/lib/python3.13/site-packages/cartopy/io/__init__.py:242: DownloadWarning: Downloading: https://naturalearth.s3.amazonaws.com/10m_physical/ne_10m_land.zip
  warnings.warn(f'Downloading: {url}', DownloadWarning)
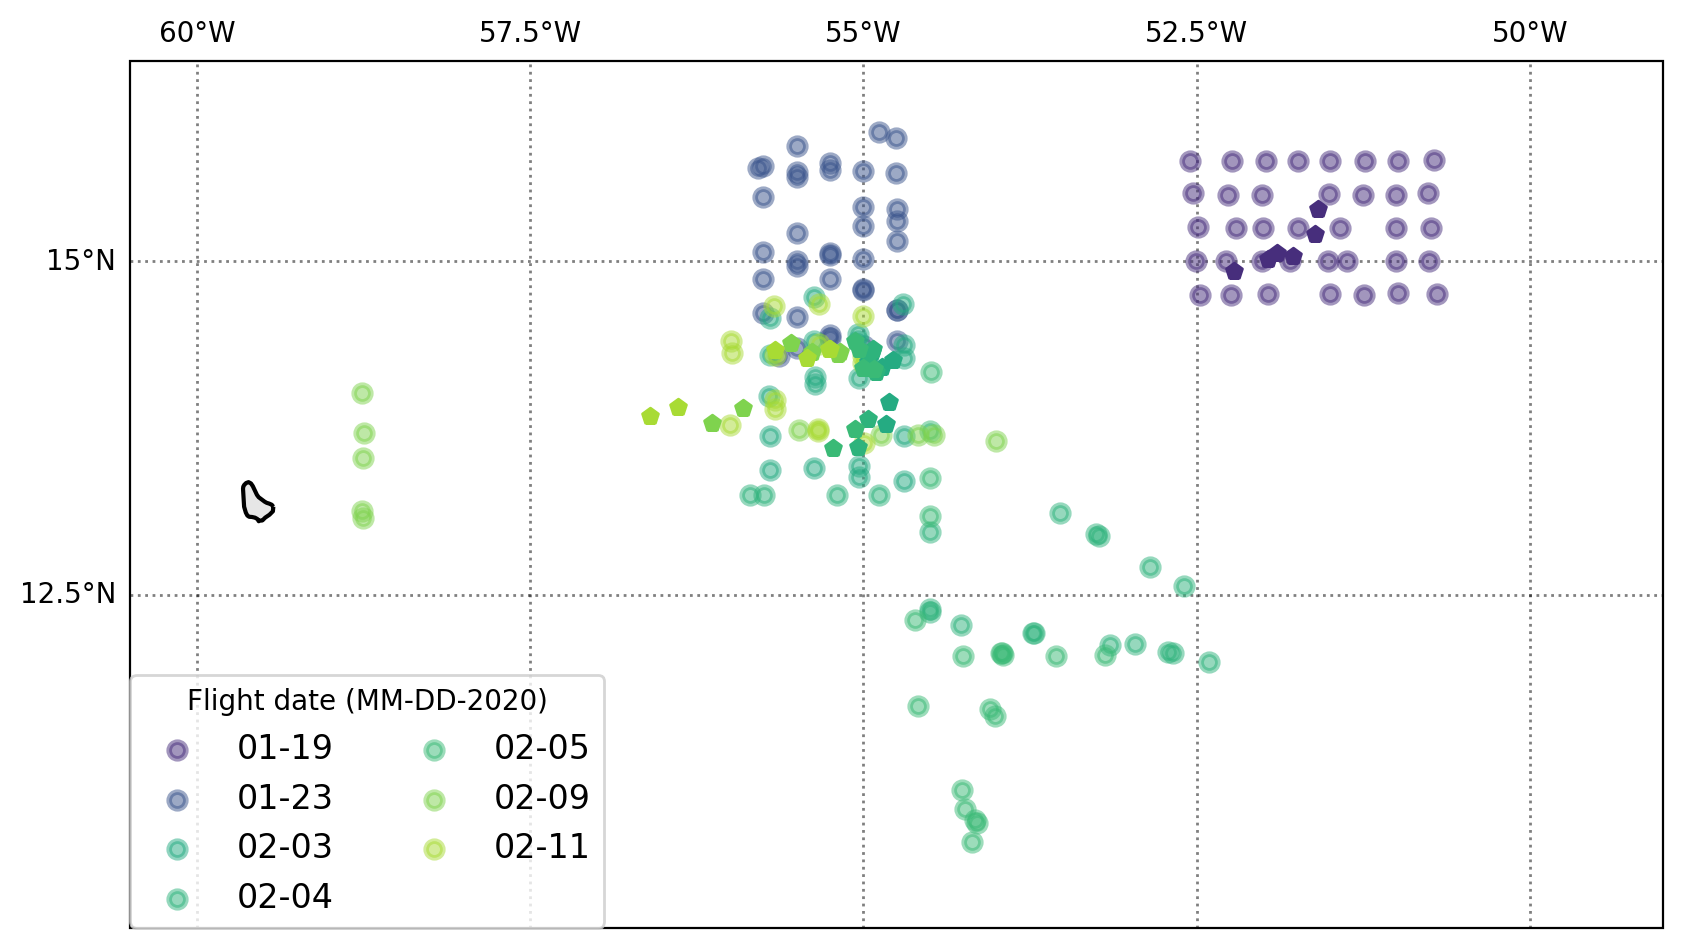
On 19 Jan and 3 Feb the AXBTs bracket the SWIFTs; on 23 Jan the SWIFTs are at the southern end of the AXBT pattern.
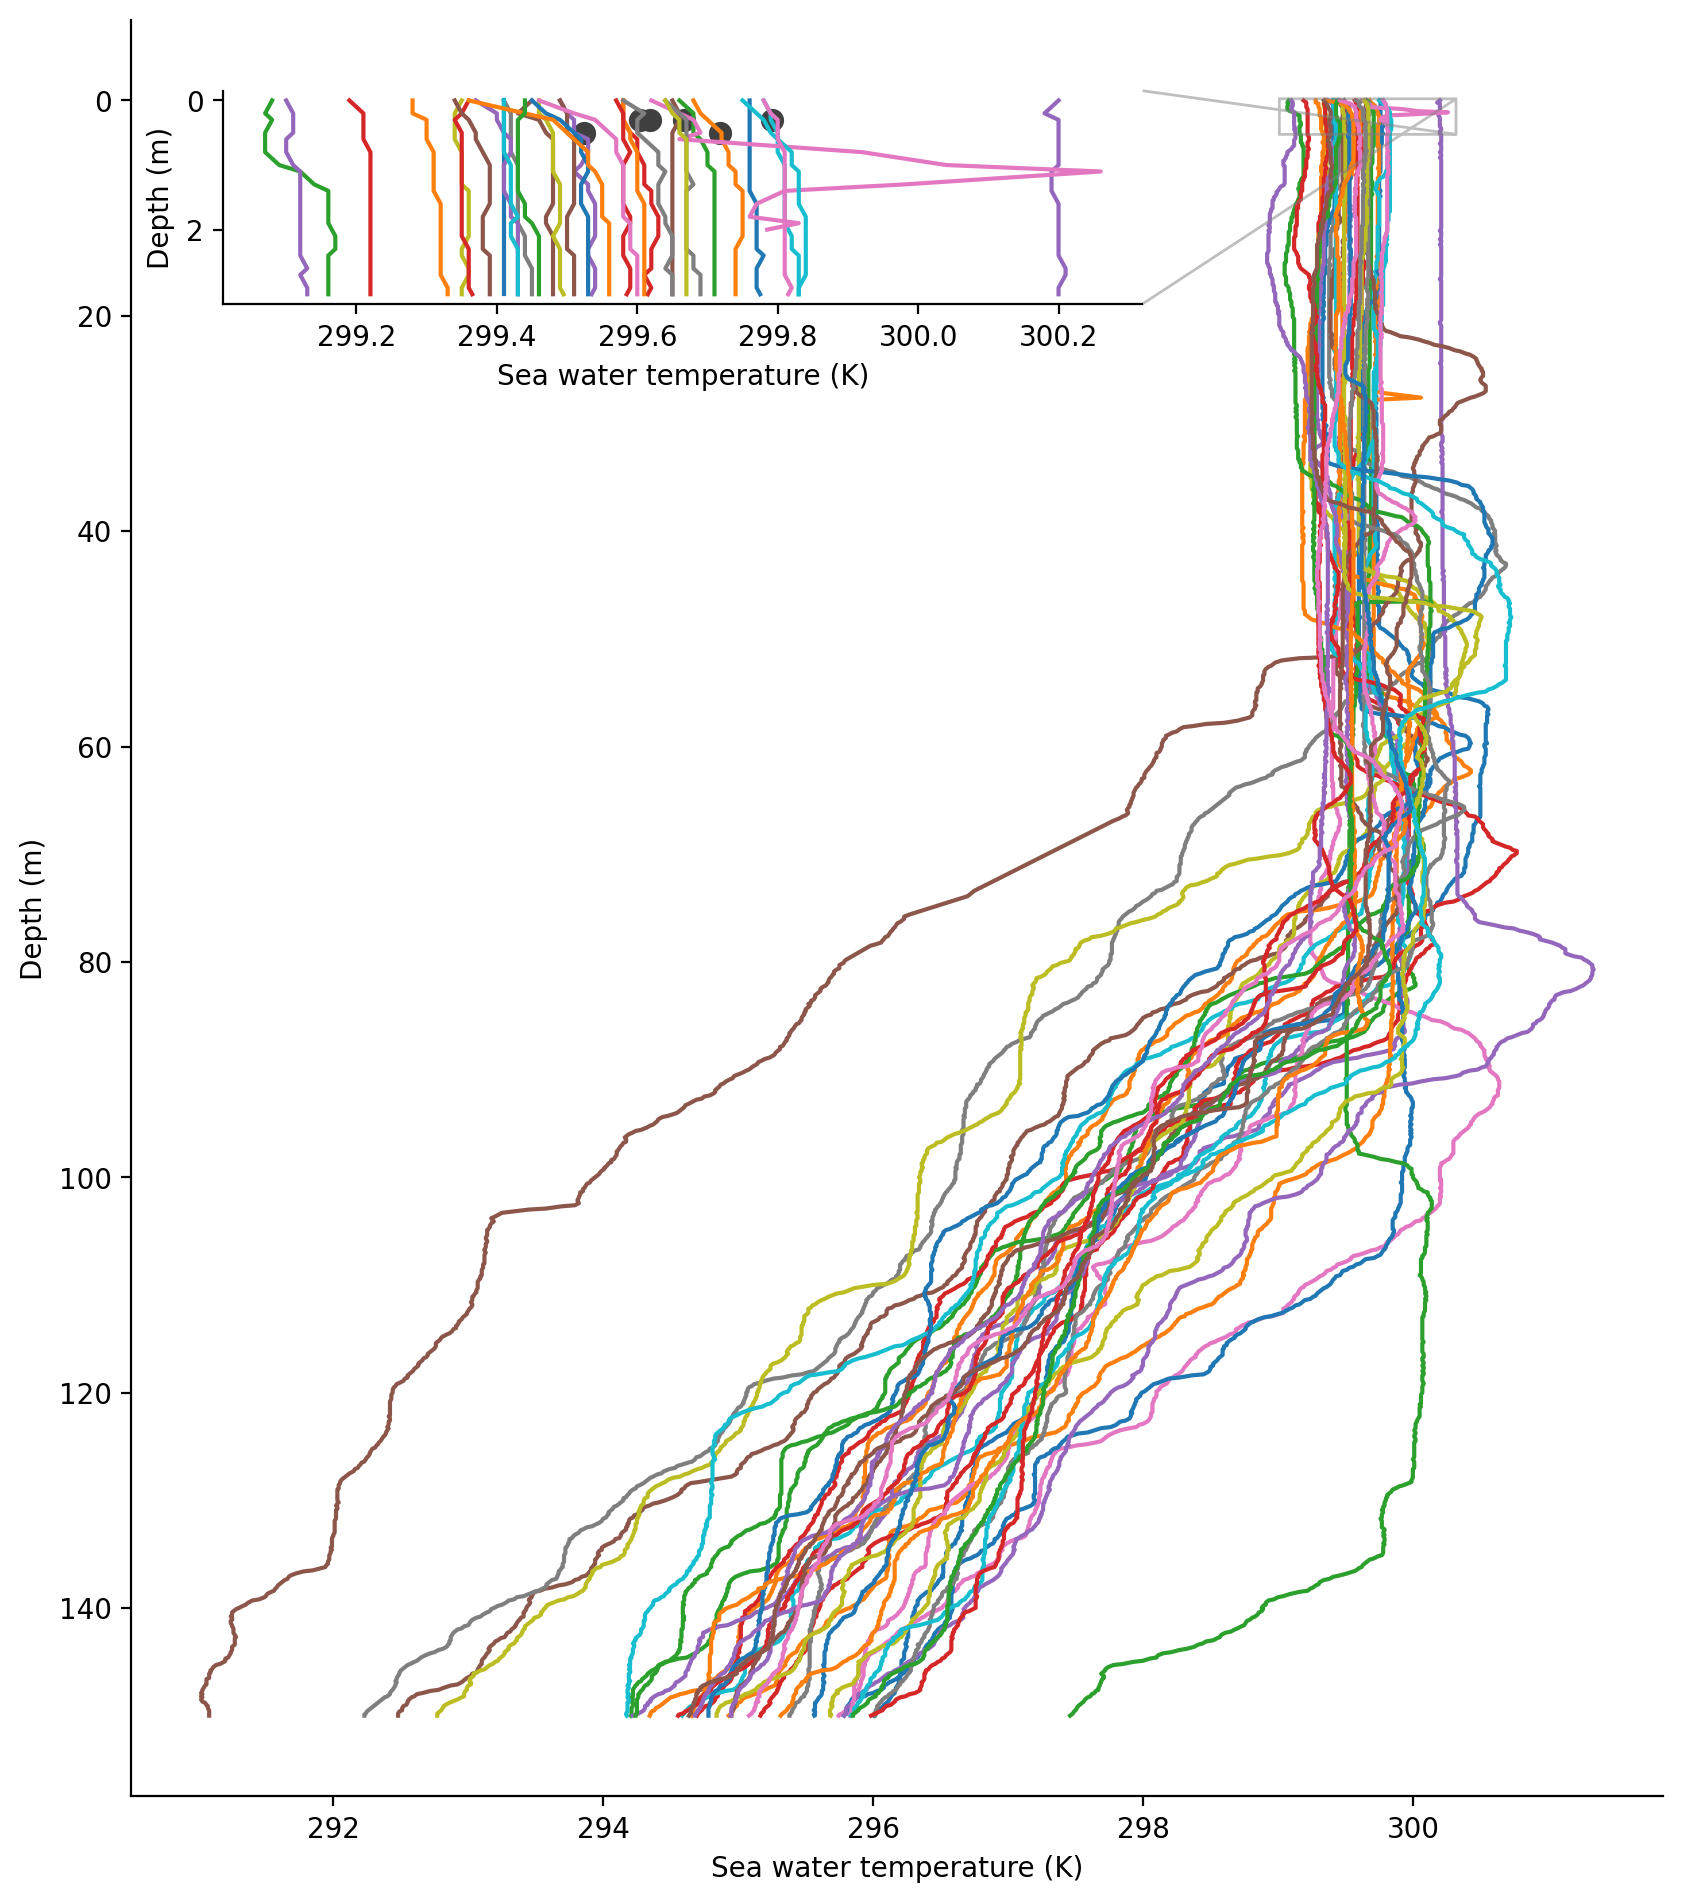
The next plot will focus on 19 Jan. Let’s look at the profile of ocean temperature in the first 150 m from the AXBTs and compare the near-surface temperatures to the SWIFTs they are surrounding.
fig, ax = plt.subplots(figsize=[8.3, 9.4])
d = np.datetime64("2020-01-19")
axbt_1day   = axbts.sel(time=slice(d, d + one_day))
# Swift data at mean of AXBT times
swifts_1day = [s.sel(time = axbt_1day.time.mean(), method = "nearest") for s in swifts]

axbt_1day.temperature.sel(depth=slice(None,150)).plot.line(y="depth",
                                                           add_legend=False, yincrease=False)
ax.set_xlabel("Sea water temperature (K)")
ax.set_ylabel("Depth (m)")

#
# Inset plot! https://matplotlib.org/3.1.1/gallery/subplots_axes_and_figures/zoom_inset_axes.html
#
axin = ax.inset_axes([0.06, 0.84, 0.6, 0.12])
axin.scatter([s.sea_water_temperature.values + 273.15 for s in swifts_1day],
             # SWIFTs 16 and 17 report water temperature at 0.5 m depth; SWIFTs 23-25 report at 0.3 m
             # See the variable long_name or  Tables 8 and 9 of Quinn et al.
             [0.5 if '0.5' in s.sea_water_temperature.long_name else 0.3 for s in swifts_1day],
             color="0.25",
             s = 1.5 * plt.rcParams['lines.markersize'] ** 2)
axbt_1day.temperature.sel(depth=slice(None,3)).plot.line(y="depth",
                                                         add_legend=False,
                                                         yincrease=False, ax = axin)
axin.set_xlabel("Sea water temperature (K)")
axin.set_ylabel("Depth (m)")
ax.indicate_inset_zoom(axin);