Synthetic measurements#
For a better comparison of the simulation output with measurements taken during EUREC4A forward operators have been applied to some output variables. In the following the resulting products are presented.
Radar measurements#
As pointed out in Cloud masks defining the boundaries of a cloud is not an easy task and depends a lot on the used instrument. How to compare these measurements with the simulation output then? In the following, we use the PAMTRA radar forward operator (Mech et al., 2020) to create synthetic radar measurements from the simulation output that can be more quantitatively be compared to the actual measurements.
The synthetic radar data is available through the EUREC4A Intake catalog and available for all meteogram locations, model experiments and domains.
Comparison with observations#
Selecting a specific synthetic radar location, in this case at the BCO.#
#Synthetic
ds_syn = cat.simulations.ICON.LES_CampaignDomain_control.synthetic_radar_BCO_DOM01.to_dask()
#Observations
ds_obs = cat.barbados.bco.radar_reflectivity.to_dask()
/home/runner/miniconda3/envs/how_to_eurec4a/lib/python3.13/site-packages/intake_xarray/base.py:21: FutureWarning: The return type of `Dataset.dims` will be changed to return a set of dimension names in future, in order to be more consistent with `DataArray.dims`. To access a mapping from dimension names to lengths, please use `Dataset.sizes`.
  'dims': dict(self._ds.dims),
Plotting timeseries#
time_min = np.datetime64('2020-02-12T00:00:00')
time_max = np.datetime64('2020-02-12T23:59:59')

# selecting subset of data
ds_sliced_syn = ds_syn.sel(time=slice(time_min, time_max))
ds_sliced_obs = ds_obs.sel(time=slice(time_min, time_max))

fig, axs = plt.subplots(2,1, sharex=True, sharey=True)
ds_sliced_syn.Z_att.where(ds_sliced_syn.Z_att > -50).plot(x='time', y='height', cmap="seismic", ax=axs[0])
ds_sliced_obs.Zf.where(ds_sliced_obs.Zf > -50).plot(x='time', y='range', cmap="seismic", ax=axs[1])
axs[0].set_ylabel('range / m');
axs[1].set_xlim(time_min, time_max)
axs[1].set_ylim(0, 4500);
axs[1].set_ylabel('range / m');
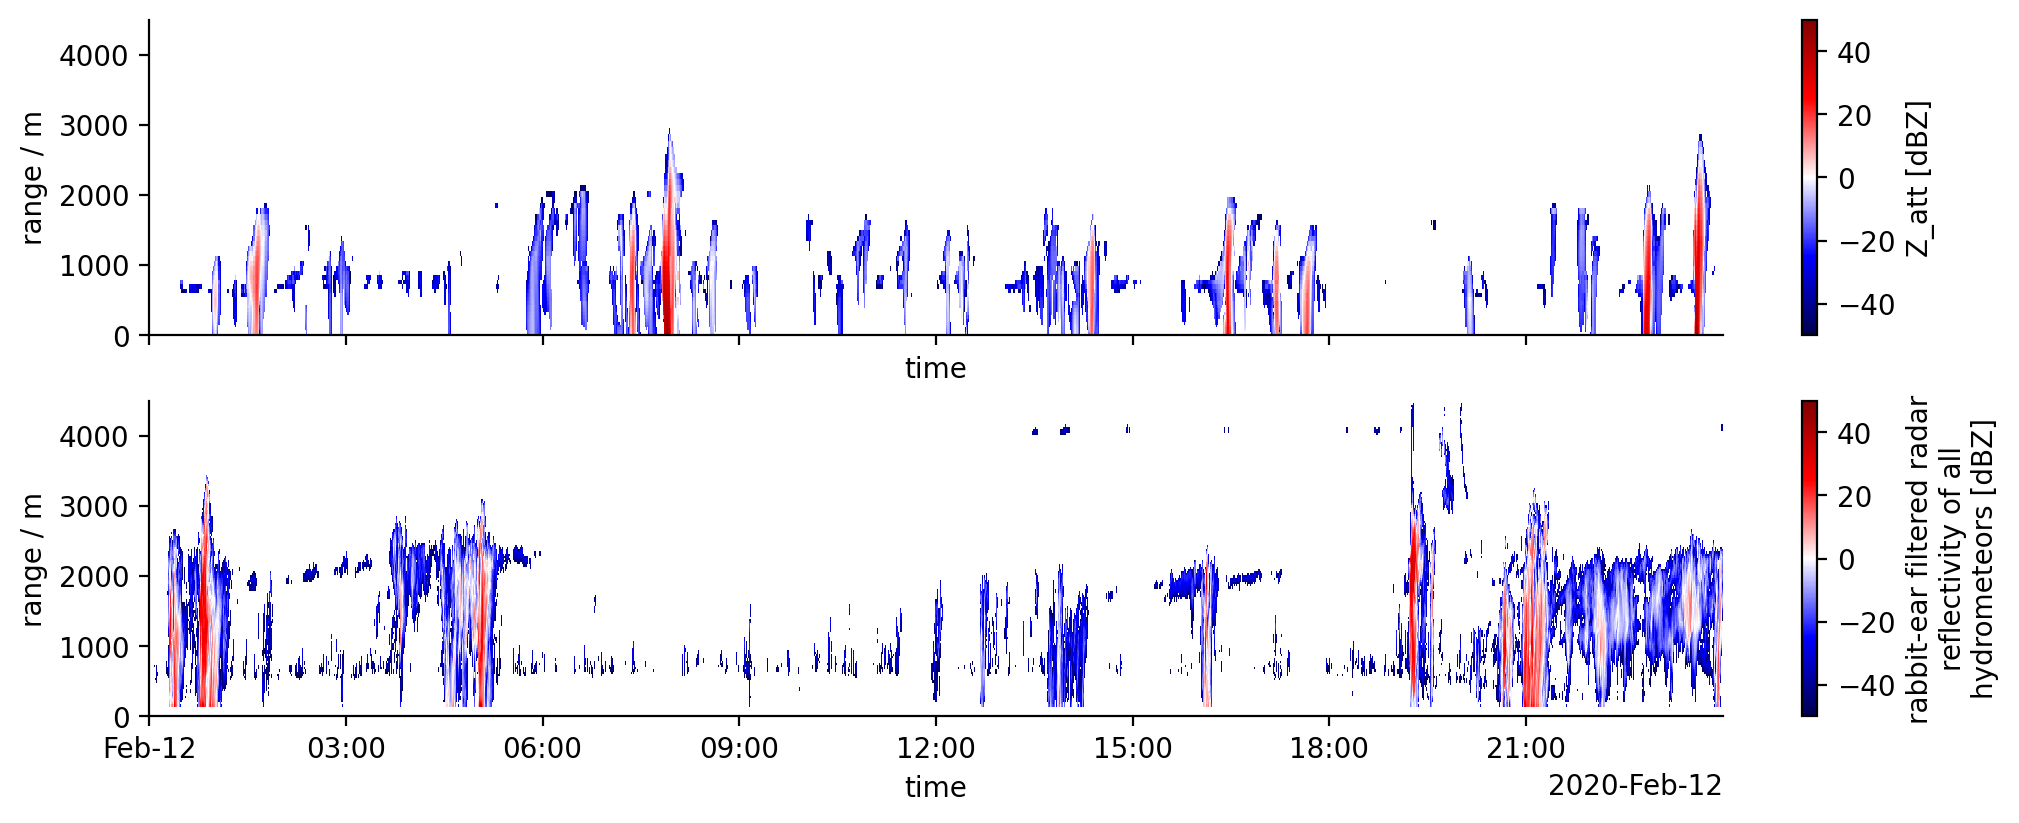
To have a similar sensitivity and exclude reflectivities originating from sea-salt (which are not captured by the simulations and therefore the forward operator) a reflecitivy threshold of -50 dBZ is applied to both sources.